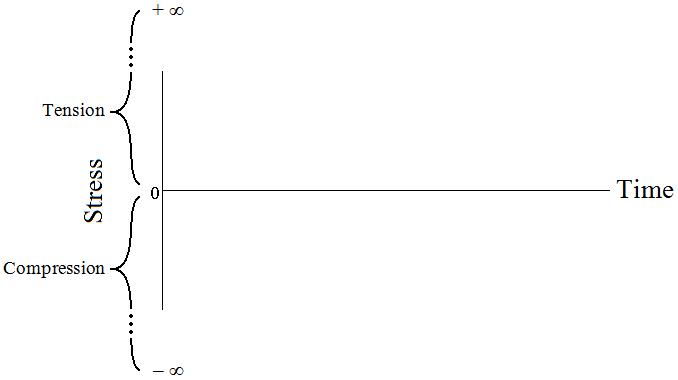
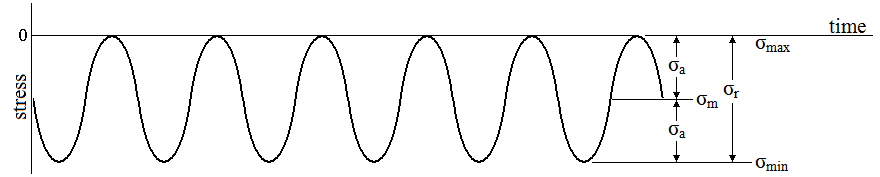
The more negative the value, the greater the compression.
| Cyclic Loading |
|
|
|
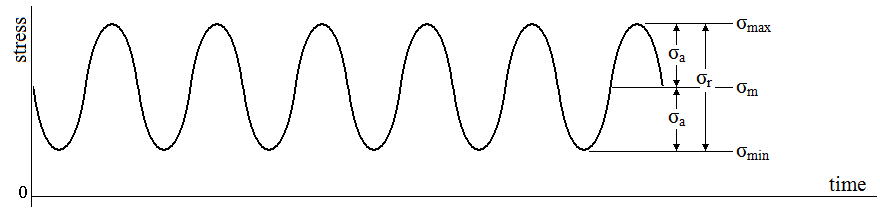
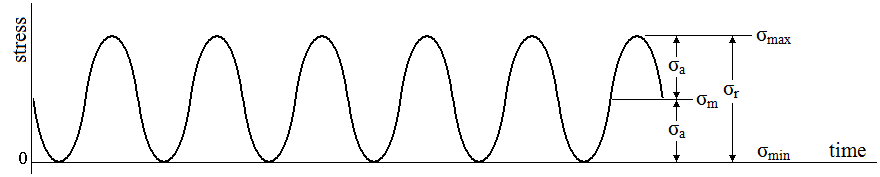
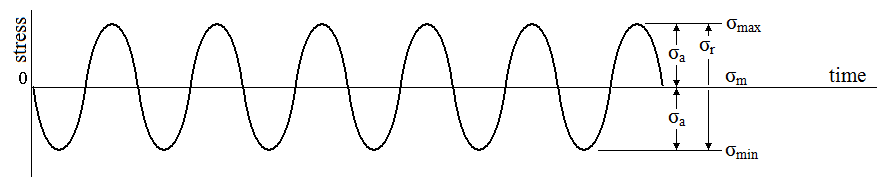
For the above cyclic loading plots, the positive stress region is tension and the negative region is compression. The more negative the value, the greater the compression. |
| symbol | description |
| σmax | maximum stress |
| σmin | minimum stress |
| σm | mean stress |
| σa | amplitude stress |
| σr or Δσ | stress range |
| R | stress ratio |
| A | amplitude ratio |
| σm = |
|
| σa = |
|
| R = |
|
| A = |
|