Stress-Strain Diagram


Diagrams

An example stress-strain diagram for a ductile material

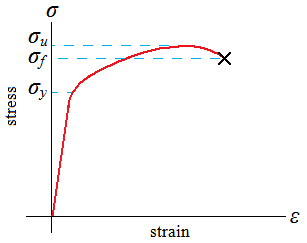
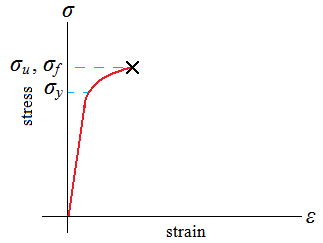
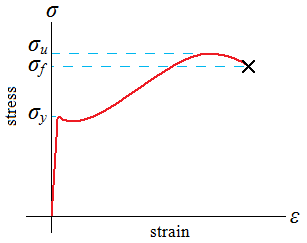
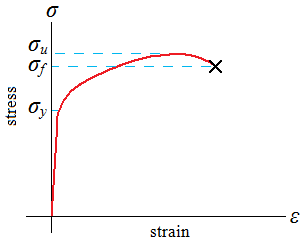
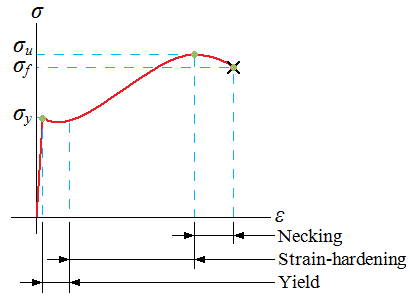
Ductile materials may exhibit a downward trend after the maximum stress is reached and fracture at point f. Others, such as cast irons and high-strength steels, fracture while the stress-strain curve is still rising, and the ultimate strength would be equal to the fracture strength, such as in the figure just below to the right, the stress-strain curve for a brittle material.
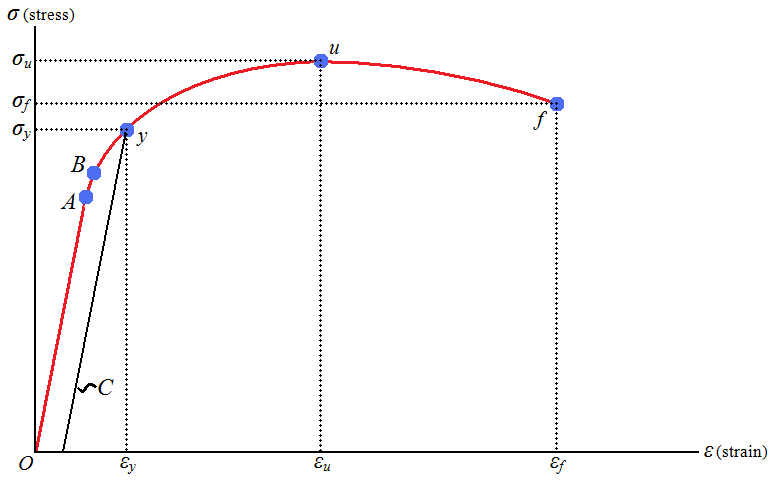
Point A is the proportional limit
Point B is the elastic limit
Point y is the yield point
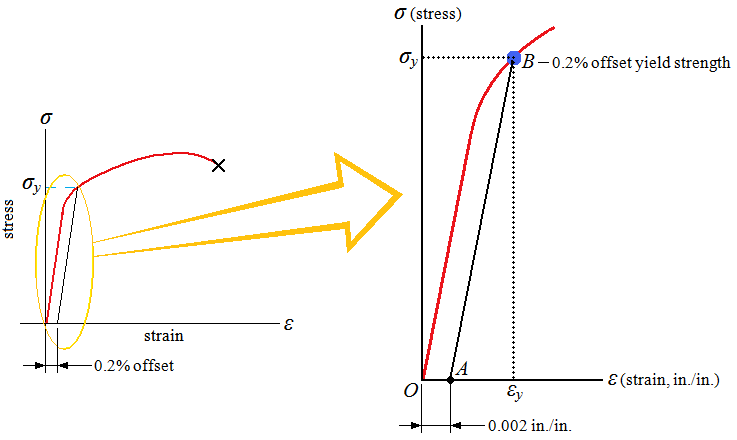
Line C is determined from the offset method and is used to determine the yield point (point y)
The slope of line OA is equal to the modulus of elasticity
Line AB is not a perfectly straight line, even though the specimen is elastic through this region
Refer to nomenclature below for the rest of the symbols

Stress-strain curve for ductile materialStress-strain curve for brittle material

Two typical looks of ductile stress-strain diagrams

Yielding represents a relatively significant deformation with respect to the change in the applied load. This deformation is caused by slippage of the material along oblique surfaces and is due, therefore, primarily to shearing stresses.
Strain-hardening can give a material a higher yield point, but make it less ductile.
Through necking, lower stresses are required to cause further elongation.

Determination of the yield strength using the offset yield method


Nomenclature

σstress
εstrain
σuultimate strength (or ultimate stress)
σf  (or σb)fracture strength (or breaking strength)
σyyield strength
εuultimate strain
εffracture strain
εyyield strain


Details

From the diagrams above, the yield strength is the stress at which yield is initiated, the ultimate stress corresponds to the maximum load applied to the specimen, and the fracture stress corresponds to rupture.

Stress-strain diagrams that use data from tensile tests are engineering stress-strain diagrams because the stresses and strains calculated from the data are not true values. The stress is based on the original area prior to the load being applied. In reality, as the load is applied the area reduces so that the actual or true stress is larger than the engineering stress. To obtain the true stress for the diagram, the load and the cross-sectional area must be measured concurrently during the test. Typically, the true stress is much higher than the engineering stress at the necked section. See the lesson: True Stress, True Strain, Engineering Stress, and Engineering Strain

If a specimen made of a ductile material were loaded in compression instead of tension, the stress-strain curve obtained would be essentially the same through its initial straight-line portion and through the beginning of the portion corresponding to yield and strain-hardening. Particularly noteworthy is the fact that for a given steel, the yield strength is the same in both tension and compression. For larger values of the strain, the tension and compression stress-strain curves diverge, and it should be noted that necking cannot occur in compression. For most brittle materials, one finds that the ultimate strength in compression is much larger than the ultimate strength in tension. This is due to the presence of flaws, such as microscopic cracks or cavities, which tend to weaken the material in tension, while not appreciably affecting its resistance to compressive failure.

An example of a brittle material with different properties in tension and compression is provided by concrete, whose stress-strain diagram is shown. On the tension side of the diagram is a linear elastic range in which the strain is proportional to the stress. After the yield point has been reached, the strain increases faster than the stress until rupture occurs. The behavior of the material in compression is different. First, the linear elastic range is significantly larger. Second, rupture does not occur as the stress reaches its maximum value. Instead, the stress decreases in magnitude while the strain keeps increasing until rupture occurs. Note that the modulus of elasticity, which is represented by the slope of the stress-strain curve in its linear portion, is the same in tension and compression. This is true of most brittle materials

The stress-strain curve for certain low-carbon steels displays a double yield point. The material is expected to plastically deform at stress σ1. However, interstitial atoms clustered around the dislocations interfere with slip and raise the yield point to σ2. Only after the higher stress σ2 is applied does the dislocations slip. After slip begins at σ2, the dislocations move away from the clusters of small atoms and continue to move very rapidly at the lower stress σ1.

Structural steel and aluminum while both ductile, have different yield characteristics. In the case of structural steel, the stress remains constant over a large range of values of the strain after the onset of yield. Later the stress must be increased to keep elongating the specimen, until the ultimate stress has been reached. This is due to a property of the material known as strain-hardening. The yield strength of structural steel can be determined during the tensile test by watching the load shown on the display of the testing machine. After increasing steadily, the load is observed to suddenly drop to a slightly lower value, which is maintained for a certain period while the specimen keeps elongating. In a very carefully conducted test, one may be able to distinguish between the upper yield point, which corresponds to the load reached just before yield starts, and the lower yield point, which corresponds to the load required to maintain yield. Since the upper yield point is transient, the lower yield point should be used to determine the yield strength of the material.


Previous Lesson: Yield Strength Next Lesson: Offset Yield Method