True Stress, True Strain, Engineering Stress, and Engineering Strain


Quick
Engineering stress is the applied load divided by the original cross-sectional area of a material. Also known as nominal stress.
True stress is the applied load divided by the actual cross-sectional area (the changing area with respect to time) of the specimen at that load
Engineering strain is the amount that a material deforms per unit length in a tensile test. Also known as nominal strain.
True strain equals the natural log of the quotient of current length over the original length as given by Eq4.


Equations
(Eq1)    
σ =
P
A0
engineering stress
(Eq2)    
σt =
P
A
true stress
(Eq3)    
ε =
δ
L0
engineering strain
(Eq4)    
εt = ln
L
L0
true strain


Nomenclature
Pload
A0cross-sectional area of specimen before deformation has taken place
Across-sectional area of specimen at which the load is applied
δtotal elongation
L0original value of the gage length
Lsuccessive values of the length as it changes


Details

The context of this lesson is written with respect to the tensile test. Sometimes the stress plotted in stress-strain diagrams is obtained by dividing the load, P, by the cross-sectional area, A0 of the specimen measured before any deformation has taken place. Since the cross-sectional area of the specimen decreases as P increases, the stress plotted in the diagram may not represent the actual stress in the specimen. The difference between the engineering stress:

(Eq1)    
σ =
P
A0

and the true stress:

(Eq2)    
σt =
P
A

obtained by dividing P by the cross-sectional area A of the deformed specimen becomes apparent in ductile materials after yield has started. While the engineering stress, σ, which is directly proportional to the load, P, decreases with P during the necking phase, the true stress σt, which is proportional to P and inversely proportional to A, is observed to keep increasing until rupture of the specimen occurs.

Many scientists also use a definition of strain different from that of the engineering strain:

(Eq3)    
ε =
δ
L0

Instead of using the total elongation δ and the original value L0 of the gage length, all the successive values of L are used that have been recorded. Dividing each increment ΔL of the distance between the gage marks, by the corresponding value of L, the elementary strain is obtained:

Δε =
ΔL
L

Adding the successive values of Δε, the true strain, εt, is defined:

εt = ∑Δε = ∑
ΔL
L

With the summation replaced by an integral, the true strain can also be expressed as follows:

εt =
L
 
L0
dL
L
= ln
L
L0

or:

(Eq4)    
εt = ln
L
L0

The diagram obtained by plotting true stress versus true strain reflects more accurately the behavior of the material. There is no decrease in true stress during the necking phase. Also, the results obtained from tensile and from compressive tests will produce essentially the same plot when true stress and true strain are used. This is not the case for large values of the strain when the engineering stress is plotted versus the engineering strain. However, engineers, whose responsibility is to determine whether a load, P, will produce an acceptable stress and an acceptable deformation in a given member, will want to use a diagram based on the engineering stress and the engineering strain, since their respective expressions involve data that are available to them, namely the cross-sectional area A0 and the length L0 of the member in its undeformed state.


The decrease in engineering stress beyond the tensile point occurs because of the definition of engineering stress. The original area A0 is used in the calculations, but this is not precise because the area continually changes. True stress is defined by:

same as above equation for true stress, P / A

True strain is given by:

εt =
dL
L
= ln
L
L0
= ln
A0
A

where A is the actual area at which the force F is applied. The expression ln (A0 / A) must be used after necking begins.

True stress and strain are often not required. When the yield strength is exceeded, the material deforms. The component has failed because it no longer has the original intended shape. Furthermore, a significant difference develops between the two curves only when necking begins. But when necking begins, the component is grossly deformed and no longer satisfies its intended use.

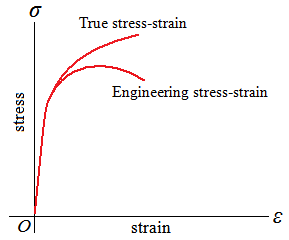
True stress continues to increase after necking because, although the load required decreases, the area decreases even more.


Previous Lesson: Necking Next Lesson: Hooke's Law


Related
▪ L - Stress-Strain Diagram
▪ L - Strain